Practising IELTS Academic Writing Task 1 is essential for building strong exam skills. In this type of question, you need to describe and compare data shown in a chart, graph, or table. This structure is explained in more detail in my IELTS writing templates guide.
Here’s a sample IELTS Writing Task 1 bar chart question, followed by model answers at Band 6, Band 7, and Band 8 levels. Comparing these will help you see what examiners are looking for at different score bands.
IELTS Writing Task 1 Question
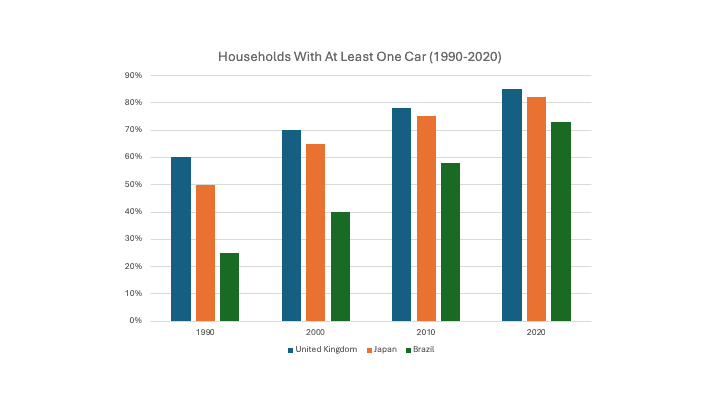
The chart below shows the percentage of households in three different countries (the United Kingdom, Japan, and Brazil) that owned at least one car between 1990 and 2020.
Write a report for a university lecturer describing the information shown below.
You should write at least 150 words.
IELTS Writing Task 1 Bar Chart Practice – Car Ownership in the UK, Japan, and Brazil (1990–2020)
The chart shows the number of households in three countries that had at least one car between 1990 and 2020.
Overall, the percentage of car ownership went up in all three countries. The UK and Japan always had more cars than Brazil, but Brazil also increased a lot.
In 1990, around 60% of households in the UK had cars. Japan was lower at about 50%, and Brazil was the lowest with only 25%. In 2000, all three countries went up, with the UK reaching 70%, Japan 65%, and Brazil 40%.
By 2010, the UK had almost 80% of households with cars, and Japan was close to 75%. Brazil also improved, going to about 58%. In the last year, 2020, the UK reached 85% and Japan 82%. Brazil increased more than before and got to about 73%.
In conclusion, all three countries saw higher car ownership, and even though Brazil was always lower, it made the biggest change.
The bar chart compares car ownership in households in the United Kingdom, Japan, and Brazil between 1990 and 2020.
Overall, the percentage of households with at least one car increased steadily in all three countries. The United Kingdom and Japan consistently had higher levels of car ownership, while Brazil, despite starting much lower, experienced the fastest growth.
In 1990, around 60% of UK households and 50% of Japanese households owned at least one car, compared with only 25% in Brazil. By 2000, the figures for the UK and Japan rose to about 70% and 65%, respectively, while Brazil reached 40%.
Growth continued over the next two decades. By 2010, car ownership had risen to nearly 80% in the UK, 75% in Japan, and 58% in Brazil. In 2020, the UK reached 85%, slightly higher than Japan at 82%, while Brazil closed the gap significantly at 73%.
In summary, car ownership became more widespread in all three countries, with Brazil showing the most dramatic increase despite starting from the lowest point.
The bar chart illustrates the proportion of households in the United Kingdom, Japan, and Brazil that owned at least one car from 1990 to 2020.
Overall, car ownership rose markedly in all three countries. While the UK and Japan consistently recorded the highest figures, Brazil demonstrated the most rapid and substantial increase, gradually narrowing the gap with the other two nations.
In 1990, the UK had the largest share of car-owning households at roughly 60%, followed by Japan at 50%, whereas Brazil lagged far behind at just one-quarter. By 2000, ownership levels in the UK and Japan had grown to approximately 70% and 65%, while Brazil remained lower but climbed to 40%.
The following decades saw continued expansion. By 2010, nearly 80% of UK households possessed a car, and Japan was close behind at 75%. Brazil, still trailing, had risen significantly to 58%. By 2020, the UK and Japan had converged at 85% and 82%, while Brazil inched up to 73%.
In summary, car ownership increased steadily in all countries. Brazil, despite beginning at the lowest level, achieved the greatest relative growth and showed clear signs of catching up with more developed nations.
To provide the best experiences, we use technologies like cookies to store and/or access device information. Consenting to these technologies will allow us to process data such as browsing behavior or unique IDs on this site. Not consenting or withdrawing consent, may adversely affect certain features and functions.
Functional
Always active
The technical storage or access is strictly necessary for the legitimate purpose of enabling the use of a specific service explicitly requested by the subscriber or user, or for the sole purpose of carrying out the transmission of a communication over an electronic communications network.
Preferences
The technical storage or access is necessary for the legitimate purpose of storing preferences that are not requested by the subscriber or user.
Statistics
The technical storage or access that is used exclusively for statistical purposes.The technical storage or access that is used exclusively for anonymous statistical purposes. Without a subpoena, voluntary compliance on the part of your Internet Service Provider, or additional records from a third party, information stored or retrieved for this purpose alone cannot usually be used to identify you.
Marketing
The technical storage or access is required to create user profiles to send advertising, or to track the user on a website or across several websites for similar marketing purposes.